
Page 18 - Superintendent Annual Report 24-25
P. 18
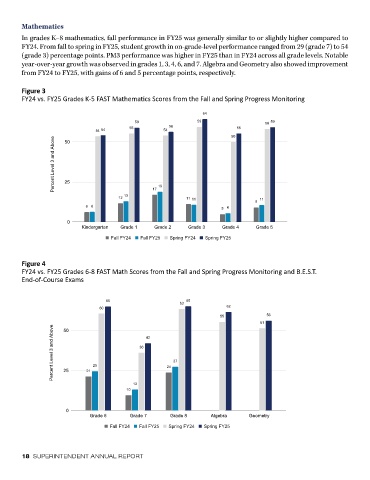
Mathematics
        In grades K–8 mathematics, fall performance in FY25 was generally similar to or slightly higher compared to
        FY24. From fall to spring in FY25, student growth in on-grade-level performance ranged from 29 (grade 7) to 54
        (grade 3) percentage points. PM3 performance was higher in FY25 than in FY24 across all grade levels. Notable
        year-over-year growth was observed in grades 1, 3, 4, 6, and 7. Algebra and Geometry also showed improvement
        from FY24 to FY25, with gains of 6 and 5 percentage points, respectively.


        Figure 3
        FY24 vs. FY25 Grades K-5 FAST Mathematics Scores from the Fall and Spring Progress Monitoring
                      75

                                                                    64
                                              59                  59                     58  59
                                 54 54      55         54  56                  55
                                                                              50
                   Percent Level 3 and Above
                      50


                      25

                                        12  13      17  19     11 11                   11
                                                                                     9
                             6 6                                          5 6

                       0
                            Kindergarten  Grade 1   Grade 2    Grade 3     Grade 4    Grade 5
                                      Fall FY24  Fall FY25  Spring FY24  Spring FY25


        Figure 4
        FY24 vs. FY25 Grades 6-8 FAST Math Scores from the Fall and Spring Progress Monitoring and B.E.S.T.
        End-of-Course Exams
                      75

                                    65                         65
                                                             63
                                  60                                        62
                                                                          55             56
                                                                                       51
                   Percent Level 3 and Above  25  36    24  27
                      50
                                                 42


                      25
                              21
                                             13
                                           10


                       0
                               Grade 6      Grade 7      Grade 8       Algebra     Geometry
                                     Fall FY24  Fall FY25  Spring FY24  Spring FY25


        18  SUPERINTENDENT ANNUAL REPORT