
Page 182 - Superintendent Annual Report 24-25
P. 182
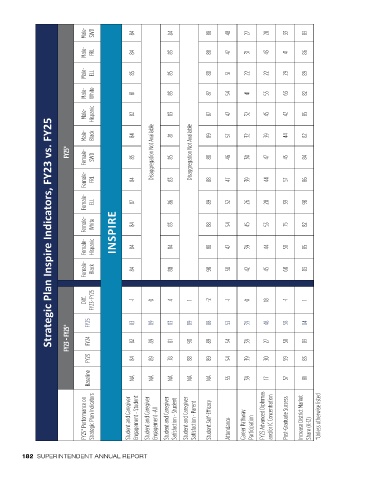
Male-   SWD     84           84           88    48    27     28    33     83


                             Male-  FRL      84           83           88    47    31     43    41     86


                             Male-  ELL      85           85           88    51    22     22    29     89


                             Male-   White   81           83           87    54    41     55    63     82


                             Male-   Hispanic  82         83           87    47    32     45    42     85
                  Strategic Plan Inspire Indicators, FY23 vs. FY25

                             Male-   Black   84           81           89    57    32     39    44     82

                        FY25*  Female-   SWD  85    Disaggregation Not Available  85  Disaggregation Not Available  88  46  30  47  45  84


                             Female-   FRL   84           83           88    47    39     44    57     86


                             Female-   ELL   87           86           89    52    26     20    39     90


                             Female-   White  INSPIRE  84  83          88    54    45     53    75     82


                             Female-   Hispanic  84       84           88    47    39     44    58     85


                             Female-   Black  84          80           90    58    42     45    60     83


                                FY23-FY25    -1     0     4     1      -2    -1    0      18    -1     1
                             Diff.


                               FY25          83     89    83    89     88    53    39     48    58     84
                        FY23 - FY25*  FY24   82     89    81    90     89    54    39     27    58     83


                               FY23          84     89    78    88     89    54    39     30    59     83

                               Baseline      NA     NA    NA    NA     NA    55    39     17    57     81


                             FY25* Performance on   Strategic Plan Indicators  Student and Caregiver   Engagement - Student  Student and Caregiver   Engagement -All  Student and Caregiver   Satisfaction - Student  Student and Caregiver   Satisfaction - Parent  Student Self-Efficacy  Attendance  Career Pathway   Participation  FY23 Advanced Diplomas   and/or IC Concentration  Post-Graduate Success  Increase District Market   Share (K-12)  *Unless otherwise listed


        182  SUPERINTENDENT ANNUAL REPORT