
Page 10 - Superintendent Report 2021-22
P. 10
Effective and Relevant Instruction
Objective 1: Ensure a shared commitment and collective responsibility for
the academic success of every student.
High School Graduation
On January 4, 2022, the Florida Department of Education (FDOE) released high school graduation
rates for the State of Florida and the District. The FY21 Federal Graduation Rate includes standard
diplomas but excludes special diplomas and General Education Diplomas (GEDs). Students with
Disabilities (SWD) on the Access Points curriculum work to earn a standard diploma and, if
successful, are included as graduates. Due to COVID-19, assessment requirements for graduation
were waived for FY20 seniors who had yet to meet the requirements and used at the District’s
discretion for FY21 seniors. This should be considered when comparing the graduation rates to prior
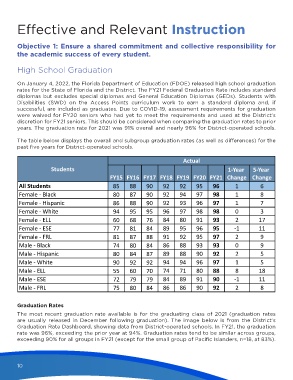
years. The graduation rate for 2021 was 91% overall and nearly 96% for District-operated schools.
The table below displays the overall and subgroup graduation rates (as well as differences) for the
past five years for District-operated schools.
Actual
Students 1-Year 5-Year
FY15 FY16 FY17 FY18 FY19 FY20 FY21 Change Change
All Students 85 88 90 92 92 95 96 1 6
Female - Black 80 87 90 92 94 97 98 1 8
Female - Hispanic 86 88 90 92 93 96 97 1 7
Female - White 94 95 95 96 97 98 98 0 3
Female - ELL 60 68 76 84 80 91 93 2 17
Female - ESE 77 81 84 89 95 96 95 -1 11
Female - FRL 81 87 88 91 92 95 97 2 9
Male - Black 74 80 84 86 88 93 93 0 9
Male - Hispanic 80 84 87 89 88 90 92 2 5
Male - White 90 92 92 94 94 96 97 1 5
Male - ELL 55 60 70 74 71 80 88 8 18
Male - ESE 72 79 79 84 89 91 90 -1 11
Male - FRL 75 80 84 86 86 90 92 2 8
Graduation Rates
The most recent graduation rate available is for the graduating class of 2021 (graduation rates
are usually released in December following graduation). The image below is from the District’s
Graduation Rate Dashboard, showing data from District-operated schools. In FY21, the graduation
rate was 96%, exceeding the prior year at 94%. Graduation rates tend to be similar across groups,
exceeding 90% for all groups in FY21 (except for the small group of Pacific Islanders, n=18, at 83%).
10
8/23/22 2:55 PM
Superintendent Report 2021-22.indd 10 8/23/22 2:55 PM
Superintendent Report 2021-22.indd 10