Page 13 - Superintendent Report 2021-22
P. 13

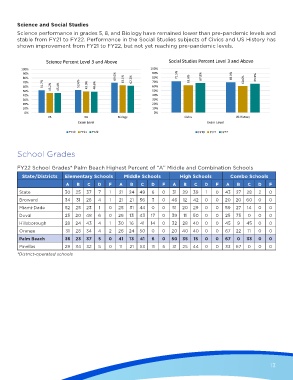
Science and Social Studies
        Science performance in grades 5, 8, and Biology have remained lower than pre-pandemic levels and
        stable from FY21 to FY22. Performance in the Social Studies subjects of Civics and US History has
        shown improvement from FY21 to FY22, but not yet reaching pre-pandemic levels.


                    Science Percent Level 3 and Above                   Social Studies Percent Level 3 and Above
          100%                                                  100%
           90%                                                   90%       71.5%
           80%                                   69.0%  63.1%  62.2%  80%       62.6%  67.8%      69.0%  60.6%  65.9%
           70%     51.7%          52.6%                          70%
           60%        45.2%  45.4%    49.0%  48.6%               60%
           50%                                                   50%
           40%                                                   40%
           30%                                                   30%
           20%                                                   20%
           10%                                                   10%
           0%                                                    0%
                     05             08            Biology                     Civics                US History
                                  Exam Level                                            Exam Level

                              FY19  FY21  FY22                                      FY19  FY21  FY22


        School Grades


        FY22 School Grades* Palm Beach Highest Percent of “A” Middle and Combination Schools
          State/Districts   Elementary Schools       Middle Schools         High Schools         Combo Schools
                             A   B    C   D    F   A   B    C   D    F   A    B   C    D   F    A   B   C    D   F
         State              30   25  37   7    1   21  24  49   6    0   31  29   39   1   0   43   27  28   2   0

         Broward            34   31  28   4    1   21  21  56   3    0   46   12  42   0   0   20   20  60   0   0
         Miami-Dade         52   25  23   1   0    25  31  44   0    0   51  20   29   0   0   59   27  14   0   0
         Duval              25   20  48   6   0   26   13  43   17   0   39   11  50   0   0   25   75   0   0   0
         Hillsborough       28   24  43   4    1  30   16   41  14   0   32  28   40   0   0   45   9   45   0   0
         Orange             31   28  34   4    2  26   24  50   0    0   20  40   40   0   0   67   22   11  0   0
         Palm Beach         36   23  37   5   0    41  13   41  6    0   50  35   15   0   0   67   0   33   0   0
         Pinellas           29   34  32   5   0    11  21  53   11   5   31  25   44   0   0   33   67   0   0   0
        *District-operated schools


                                                                                                                  13


                                                                                                                 8/23/22   2:55 PM
   Superintendent Report 2021-22.indd   13
   Superintendent Report 2021-22.indd   13                                                                       8/23/22   2:55 PM
   8   9   10   11   12   13   14   15   16   17   18