
Page 27 - Superintendent Report 2021-22
P. 27
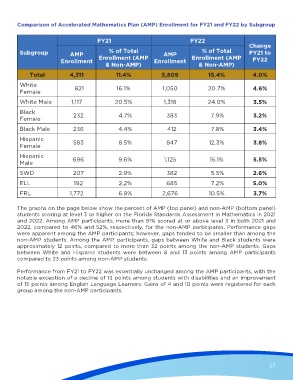
Comparison of Accelerated Mathematics Plan (AMP) Enrollment for FY21 and FY22 by Subgroup


                                          FY21                                  FY22
                                                                                                         Change
         Subgroup             AMP              % of Total            AMP             % of Total          FY21 to
                          Enrollment      Enrollment (AMP        Enrollment      Enrollment (AMP           FY22
                                             & Non-AMP)                             & Non-AMP)
              Total           4,311              11.4%               5,809              15.4%              4.0%

         White                   821              16.1%              1,050              20.7%              4.6%
         Female

         White Male            1,117             20.5%               1,318              24.0%              3.5%
         Black                  232                4.7%                383               7.9%              3.2%
         Female

         Black Male             236                4.4%                412               7.8%              3.4%
         Hispanic               583                8.5%                847              12.3%              3.8%
         Female

         Hispanic               696                9.6%               1,125              15.1%             5.5%
         Male
         SWD                    207                2.9%                382               5.5%              2.6%

         ELL                    192                2.2%                685               7.2%              5.0%

         FRL                  1,772                6.8%              2,676              10.5%              3.7%


        The graphs on the page below show the percent of AMP (top panel) and non-AMP (bottom panel)
        students scoring at level 3 or higher on the Florida Standards Assessment in Mathematics in 2021
        and 2022. Among AMP participants, more than 91% scored at or above level 3 in both 2021 and
        2022, compared to 46% and 52%, respectively, for the non-AMP participants. Performance gaps
        were apparent among the AMP participants; however, gaps tended to be smaller than among the
        non-AMP students. Among the AMP participants, gaps between White and Black students were
        approximately 12 points, compared to more than 32 points among the non-AMP students. Gaps
        between White and Hispanic students were between 8 and 13 points among AMP participants
        compared to 23 points among non-AMP students.

        Performance from FY21 to FY22 was essentially unchanged among the AMP participants, with the
        notable exception of a decline of 13 points among students with disabilities and an improvement
        of 15 points among English Language Learners. Gains of 4 and 10 points were registered for each
        group among the non-AMP participants.


                                                                                                                  27


                                                                                                                 8/23/22   2:55 PM
   Superintendent Report 2021-22.indd   27
   Superintendent Report 2021-22.indd   27                                                                       8/23/22   2:55 PM