
Page 40 - Superintendent Annual Report 24-25
P. 40
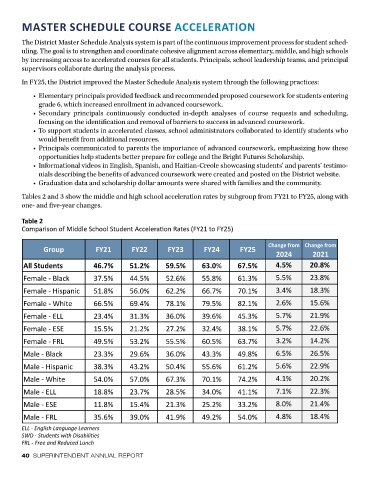
Table 1
   Comparison of Middle School Student Acceleration Rates (FY21 to FY25)
        MASTER SCHEDULE COURSE ACCELERATION                                               Change from  Change from
                                 FY21
                                                                                FY25
                                                         FY23
                Group
                                             FY22
                                                                     FY24
                                                                                                        2021
                                                                                            2024
                                                                                                       26.0%
                                                                                            4.2%
         All Students
                                                        80.4%
                                            69.6%
                                                                    85.5%
        The District Master Schedule Analysis system is part of the continuous improvement process for student sched-
                                 63.7%
                                                                                89.7%
        uling. The goal is to strengthen and coordinate cohesive alignment across elementary, middle, and high schools
                                                                                            3.9%
                                                                                                       30.8%
                                            67.6%
                                 58.6%
                                                                    85.5%
                                                                                89.4%
                                                        80.9%
         Female - Black
        by increasing access to accelerated courses for all students. Principals, school leadership teams, and principal
         Female - Hispanic
                                                        78.0%
                                            67.9%
                                 62.0%
        supervisors collaborate during the analysis process.        84.0%       89.3%       5.3%       27.3%
         Female - White          76.6%      80.9%       89.9%       92.5%       94.0%       1.5%       17.4%
        In FY25, the District improved the Master Schedule Analysis system through the following practices:
         Female - ELL            31.0%      45.2%       61.9%       71.3%       80.5%       9.2%       49.5%
            •  Elementary principals provided feedback and recommended proposed coursework for students entering
         Female - ESE            32.5%      42.2%       58.9%       68.3%       74.4%       6.1%       41.9%
              grade 6, which increased enrollment in advanced coursework.
            •  Secondary  principals  continuously  conducted  in-depth  analyses  of  course  requests  and  scheduling,
         Female - FRL            60.0%      71.4%       79.0%       85.3%       88.7%       3.4%       28.7%
              focusing on the identification and removal of barriers to success in advanced coursework.
         Male - Black            49.7%      60.3%       73.6%       79.8%       85.8%       6.0%       36.1%
            •  To support students in accelerated classes, school administrators collaborated to identify students who
         Male - Hispanic         57.9%      61.5%                   80.3%       87.0%       6.7%       29.1%
              would benefit from additional resources.  72.0%
            •  Principals communicated to parents the importance of advanced coursework, emphasizing how these
         Male - White            74.6%      77.2%       88.2%       90.5%       92.0%       1.5%       17.4%
              opportunities help students better prepare for college and the Bright Futures Scholarship.
         Male - ELL              30.2%      42.7%       56.9%       69.7%       80.5%      10.8%       50.3%
            •  Informational videos in English, Spanish, and Haitian-Creole showcasing students’ and parents’ testimo-
              nials describing the benefits of advanced coursework were created and posted on the District website.
         Male - ESE              31.5%      41.0%       57.9%       66.1%       71.7%       5.6%       40.2%
            •  Graduation data and scholarship dollar amounts were shared with families and the community.
         Male - FRL              53.7%      64.3%       72.8%       80.8%       85.8%       5.0%       32.1%
        Tables 2 and 3 show the middle and high school acceleration rates by subgroup from FY21 to FY25, along with
        one- and five-year changes.

        Table 2
   Table 2
        Comparison of Middle School Student Acceleration Rates (FY21 to FY25)
   Comparison of High School Student Acceleration Rates (FY21 to FY25)
                                                                                          Change from  Change from
               Group             FY21        FY22        FY23       FY24        FY25
                                                                                            2024        2021
         All Students           46.7%       51.2%       59.5%       63.0%       67.5%       4.5%        20.8%
         Female - Black         37.5%       44.5%       52.6%       55.8%       61.3%       5.5%        23.8%
         Female - Hispanic      51.8%       56.0%       62.2%       66.7%       70.1%       3.4%        18.3%
         Female - White         66.5%       69.4%       78.1%       79.5%       82.1%       2.6%        15.6%
         Female - ELL           23.4%       31.3%       36.0%       39.6%       45.3%       5.7%        21.9%
         Female - ESE           15.5%       21.2%       27.2%       32.4%       38.1%       5.7%        22.6%
         Female - FRL           49.5%       53.2%       55.5%       60.5%       63.7%       3.2%        14.2%
         Male - Black           23.3%       29.6%       36.0%       43.3%       49.8%       6.5%        26.5%
         Male - Hispanic        38.3%       43.2%       50.4%       55.6%       61.2%       5.6%        22.9%
         Male - White           54.0%       57.0%       67.3%       70.1%       74.2%       4.1%        20.2%
         Male - ELL             18.8%       23.7%       28.5%       34.0%       41.1%       7.1%        22.3%

         Male - ESE             11.8%       15.4%       21.3%       25.2%       33.2%       8.0%        21.4%
         Male - FRL             35.6%       39.0%       41.9%       49.2%       54.0%       4.8%        18.4%

        ELL - English Language Learners
        SWD - Students with Disabilities

        FRL - Free and Reduced Lunch
        40  SUPERINTENDENT ANNUAL REPORT