
Page 36 - Superintendent Annual Report 24-25
P. 36
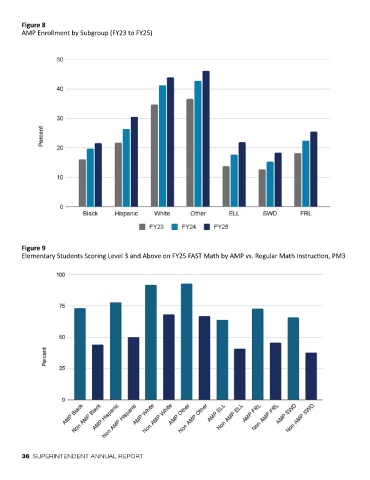
Figure 8
        AMP Enrollment by Subgroup (FY23 to FY25)


           Figure 2

           Elementary Students Scoring Level 3 and Above on FY25 FAST Math by AMP vs Regular Math Instruction,
            Figure 9
           Progress Monitoring 3
        Elementary Students Scoring Level 3 and Above on FY25 FAST Math by AMP vs. Regular Math Instruction, PM3

          Figure 2
          Elementary Students Scoring Level 3 and Above on FY25 FAST Math by AMP vs Regular Math Instruction,
          Progress Monitoring 3


        36  SUPERINTENDENT ANNUAL REPORT


           Figure 3

          Figure 3