


Page 14 - Demo
P. 14
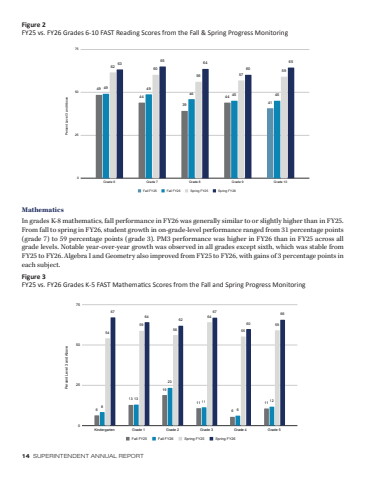
14 SUPERINTENDENT ANNUAL REPORTFigure 2FY25 vs. FY26 Grades 6-10 FAST Reading Scores from the Fall & Spring Progress MonitoringMathematicsIn grades K-8 mathematics, fall performance in FY26 was generally similar to or slightly higher than in FY25. From fall to spring in FY26, student growth in on-grade-level performance ranged from 31 percentage points (grade 7) to 59 percentage points (grade 3). PM3 performance was higher in FY26 than in FY25 across all grade levels. Notable year-over-year growth was observed in all grades except sixth, which was stable from FY25 to FY26. Algebra I and Geometry also improved from FY25 to FY26, with gains of 3 percentage points in each subject.Figure 3FY25 vs. FY26 Grades K-5 FAST Mathematics Scores from the Fall and Spring Progress Monitoring494439444149 4946 45 4562 6056 575963 65 646065Percent Level 3 and Above0255075Grade 6 Grade 7 Grade 8 Grade 9 Grade 10Fall FY25 Fall FY26 Spring FY25 Spring FY26613191161181323116125459566455596764 62676066Percent Level 3 and Above0255075Kindergarten Grade 1 Grade 2 Grade 3 Grade 4 Grade 5Fall FY25 Fall FY26 Spring FY25 Spring FY26


