
Page 36 - Superintendent Annual Report 2023-24
P. 36
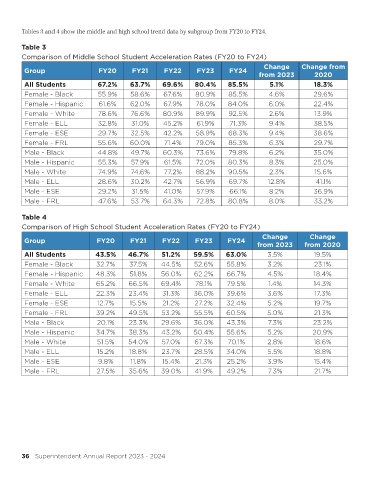
Tables 3 and 4 show the middle and high school trend data by subgroup from FY20 to FY24.

        Table 3
        Comparison of Middle School Student Acceleration Rates (FY20 to FY24)
                                                                                        Change       Change from
         Group                    FY20       FY21      FY22       FY23       FY24
                                                                                       from 2023         2020
         All Students            67.2%      63.7%      69.6%     80.4%      85.5%         5.1%           18.3%
         Female - Black          55.9%      58.6%      67.6%      80.9%      85.5%        4.6%           29.6%
         Female - Hispanic        61.6%     62.0%      67.9%      78.0%     84.0%         6.0%           22.4%
         Female - White          78.6%      76.6%      80.9%      89.9%      92.5%        2.6%           13.9%
         Female - ELL            32.8%      31.0%      45.2%      61.9%      71.3%        9.4%           38.5%
         Female - ESE            29.7%      32.5%      42.2%      58.9%      68.3%        9.4%           38.6%
         Female - FRL            55.6%      60.0%      71.4%      79.0%      85.3%        6.3%           29.7%
         Male - Black            44.8%      49.7%      60.3%      73.6%      79.8%        6.2%           35.0%
         Male - Hispanic         55.3%      57.9%      61.5%      72.0%      80.3%        8.3%           25.0%
         Male - White            74.9%      74.6%      77.2%      88.2%      90.5%        2.3%           15.6%
         Male - ELL              28.6%      30.2%      42.7%      56.9%      69.7%        12.8%          41.1%
         Male - ESE              29.2%       31.5%     41.0%      57.9%      66.1%        8.2%           36.9%
         Male - FRL               47.6%     53.7%      64.3%      72.8%     80.8%         8.0%           33.2%

        Table 4
        Comparison of High School Student Acceleration Rates (FY20 to FY24)
                                                                                        Change         Change
         Group                   FY20       FY21       FY22       FY23      FY24
                                                                                      from 2023       from 2020
         All Students            43.5%     46.7%      51.2%      59.5%      63.0%         3.5%           19.5%
         Female - Black          32.7%      37.5%     44.5%      52.6%      55.8%         3.2%           23.1%
         Female - Hispanic       48.3%      51.8%     56.0%      62.2%      66.7%        4.5%            18.4%
         Female - White          65.2%      66.5%     69.4%       78.1%     79.5%         1.4%           14.3%
         Female - ELL            22.3%      23.4%      31.3%     36.0%      39.6%        3.6%            17.3%
         Female - ESE            12.7%      15.5%      21.2%     27.2%      32.4%         5.2%           19.7%
         Female - FRL            39.2%      49.5%     53.2%      55.5%      60.5%        5.0%            21.3%
         Male - Black            20.1%      23.3%     29.6%      36.0%      43.3%         7.3%           23.2%
         Male - Hispanic         34.7%      38.3%     43.2%      50.4%      55.6%         5.2%          20.9%
         Male - White            51.5%     54.0%       57.0%     67.3%      70.1%         2.8%           18.6%
         Male - ELL              15.2%      18.8%      23.7%     28.5%      34.0%         5.5%           18.8%
         Male - ESE              9.8%       11.8%      15.4%      21.3%     25.2%        3.9%            15.4%
         Male - FRL              27.5%      35.6%     39.0%      41.9%      49.2%         7.3%           21.7%


        36   Superintendent Annual Report 2023 - 2024