
Page 38 - Superintendent Annual Report 2023-24
P. 38
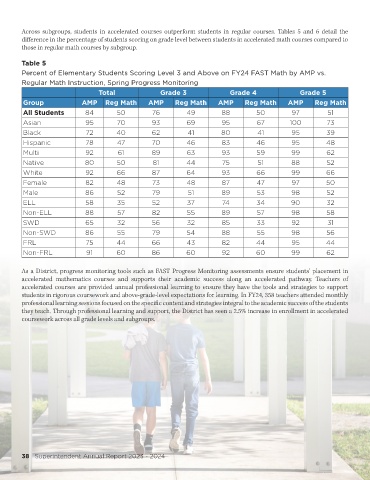
Across  subgroups,  students  in  accelerated  courses  outperform  students  in  regular  courses.  Tables  5  and  6  detail  the
        difference in the percentage of students scoring on grade level between students in accelerated math courses compared to
        those in regular math courses by subgroup.

        Table 5
        Percent of Elementary Students Scoring Level 3 and Above on FY24 FAST Math by AMP vs.
        Regular Math Instruction, Spring Progress Monitoring
                                  Total               Grade 3                Grade 4                Grade 5
         Group              AMP     Reg Math      AMP      Reg Math      AMP      Reg Math      AMP      Reg Math
         All Students        84         50         76          49         88          50          97         51
         Asian               95         70         93          69         95          67         100         73

         Black               72         40         62          41         80          41         95          39
         Hispanic            78         47         70          46         83          46         95          48
         Multi               92         61         89          63         93          59         99          62
         Native              80         50          81         44         75          51         88          52
         White               92         66         87          64         93          66         99          66
         Female              82         48         73          48         87          47          97         50
         Male                86         52         79          51         89          53         98          52
         ELL                 58         35         52          37         74          34         90          32
         Non-ELL             88         57         82          55         89          57         98          58
         SWD                 65         32         56          32         85          33         92          31
         Non-SWD             86         55         79          54         88          55         98          56
         FRL                 75         44         66          43         82          44         95          44
         Non-FRL              91        60         86          60         92          60         99          62


        As a District, progress monitoring tools such as FAST Progress Monitoring assessments ensure students’ placement in
        accelerated  mathematics  courses  and  supports  their  academic  success  along  an  accelerated  pathway.  Teachers  of
        accelerated courses are provided annual professional learning to ensure they have the tools and strategies to support
        students in rigorous coursework and above-grade-level expectations for learning. In FY24, 358 teachers attended monthly
        professional learning sessions focused on the specific content and strategies integral to the academic success of the students
        they teach. Through professional learning and support, the District has seen a 2.5% increase in enrollment in accelerated
        coursework across all grade levels and subgroups.


        38   Superintendent Annual Report 2023 - 2024