
Page 143 - Superintendent Annual Report 24-25
P. 143
on requisitions, guaranteeing that all purchases were properly authorized and fully aligned with the District’s
established contracts and procurement policies.
Department of Risk & Benefits Management
The American Heart Association (AHA) recognized the District as a 2024 Gold Level Workforce Well-Being
employer. This significant achievement marks the 12th consecutive year that the AHA has honored the District
for its dedication to implementing a comprehensive wellness program based on established best practices in
workforce wellness and culture. The AHA recognition emphasizes the District’s ongoing commitment to the
well-being of its employees through the continued implementation of a high-quality workforce health and
wellness program.
According to the AHA, rigorous studies have consistently shown that thoughtfully designed, fully implemented,
and thoroughly evaluated workforce health and wellness programs can lead to tangible benefits, such as
improved employee health outcomes, increased productivity, and better employee retention rates. The District
continues to share its gold status ranking with other large school districts and private sector employers,
6.17.25
Reviewed & Approved
including The Breakers and Delta Air Lines.
Department Quality Services Survey
DEPARTMENT QUALITY SERVICES SURVEY
The FY25 Department Quality Services (DQS) Survey was administered in May. A total of 179 principals were
The FY25 Department Quality Services (DQS) Survey was administered in May. A total of 179 principals were
invited to provide input via the survey; 175 (97.8%) responded, which is an increase in participation from
invited to provide input via the survey; 175 (97.8%) responded, which is an increase in participation from 91.2%
91.2% in FY24. Participation from the latest DQS increased for each school type compared to the FY24
in FY24. Participation from the latest DQS increased for each school type compared to the FY24 administration:
administration:
• Elementary: 110 (100%), up from 104 (94.5%)
● Elementary: 110 (100%), up from 104 (94.5%)
• Middle: 33 (100%), up from 29 (87.9%)
● Middle: 33 (100%), up from 29 (87.9%)
• High: 23 (95.8%), up from 21 (87.5%)
● High: 23 (95.8%), up from 21 (87.5%)
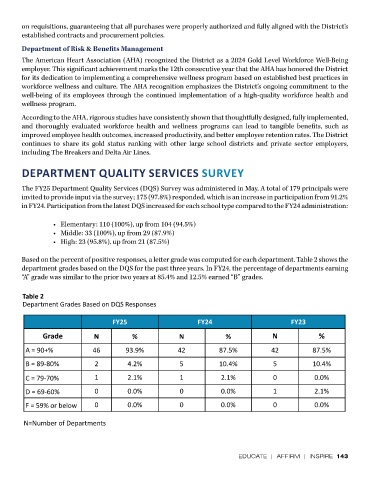
Based on the percent of positive responses, a letter grade was computed for each department. Table 2 shows the
Based on the percent of positive responses, a letter grade was computed for each department. Table 1
department grades based on the DQS for the past three years. In FY24, the percentage of departments earning
shows the department grades based on the DQS for the past three years. In FY24, the percentage of
“A” grade was similar to the prior two years at 85.4% and 12.5% earned “B” grades.
departments earning “A” grade was similar to the prior two years at 85.4% and 12.5% earned “B” grades.
Table 2
Table 1
Department Grades Based on DQS Responses
Department Grades Based on DQS Responses
FY25 FY24 FY23
Grade N % N % N %
A = 90+% 46 93.9% 42 87.5% 42 87.5%
B = 89-80% 2 4.2% 5 10.4% 5 10.4%
C = 79-70% 1 2.1% 1 2.1% 0 0.0%
D = 69-60% 0 0.0% 0 0.0% 1 2.1%
F = 59% or below 0 0.0% 0 0.0% 0 0.0%
N=Number of Departments
EDUCATE | AFFIRM | INSPIRE 143