Page 144 - Superintendent Annual Report 24-25
P. 144

Reviewed & Approved
         Table 2             6.17.25 but need to confirm office/division names. 7-15-25 Headings in table centered.
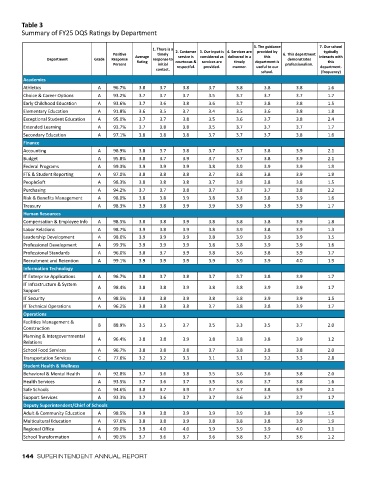
        Table 3
         Summary of FY25 DQS Ratings by Department
        Summary of FY25 DQS Ratings by Department

                                                                                     5. The guidance       7. Our school
                                                    1. There is a   2. Customer  3. Our input is  4. Services are   provided by   typically
                                      Positive       timely                                    6. This department
                                                            service is
                                                                                        this
                 Department     Grade   Response   Average   response to   courteous &   considered as  delivered in a   department is   demonstrates   interacts with
                                                                                                             this
                                              Rating
                                                                    services are
                                                                              timely
                                      Percent        initial   respectful.   provided.   manner.   useful to our   professionalism.   department.
                                                     contact.
                                                                                       school.             (frequency)
         Academics
         Athletics               A     96.7%   3.8    3.7    3.8      3.7      3.8      3.8        3.8       1.6
         Choice & Career Options   A   93.2%   3.7    3.7    3.7      3.5      3.7      3.7        3.7       1.7
         Early Childhood Education   A   93.6%   3.7   3.6   3.8      3.6      3.7      3.8        3.8       1.5
         Elementary Education    A     91.8%   3.6    3.5    3.7      3.4      3.5      3.6        3.8       1.8
         Exceptional Student Education   A   95.0%   3.7   3.7   3.8   3.5     3.6      3.7        3.8       2.4
         Extended Learning       A     93.7%   3.7    3.8    3.8      3.5      3.7      3.7        3.7       1.7
         Secondary Education     A     97.1%   3.8    3.8    3.8      3.7      3.7      3.7        3.8       1.6
         Finance
         Accounting              A     96.9%   3.8    3.7    3.8      3.7      3.7      3.8        3.9       2.1
         Budget                  A     95.8%   3.8    3.7    3.9      3.7      3.7      3.8        3.9       2.1
         Federal Programs        A     99.3%   3.9    3.9    3.9      3.8      3.9      3.9        3.9       1.9
         FTE & Student Reporting   A   97.0%   3.8    3.8    3.8      3.7      3.8      3.8        3.9       1.9
         PeopleSoft              A     98.3%   3.8    3.8    3.8      3.7      3.8      3.8        3.8       1.5
         Purchasing              A     94.2%   3.7    3.7    3.8      3.7      3.7      3.7        3.8       2.2
         Risk & Benefits Management   A   98.0%   3.8   3.8   3.9     3.8      3.8      3.8        3.9       1.6
         Treasury                A     98.3%   3.9   1. There is a   2. Customer  3. Our input is  4. Services are   5. The guidance   3.9   7. Our school
                                                                                        3.9
                                                                               3.9
                                                                                                             1.7
                                                             3.9
                                                      3.8
                                                                      3.9
                                                                                                            typically
                                                                                      provided by
         Human Resources              Positive   Average   timely   service is   considered as  delivered in a   this   6. This department   interacts with
                 Department     Grade   Response    response to                                 demonstrates
                                                                                                             this
                                                                              timely
                                                             3.9
                                                                      3.8
                                                      3.8
                                       98.5%
                                               3.8
                                                                                        3.8
                                                                               3.8
         Compensation & Employee Info   A   Percent   Rating   initial   courteous &   services are   manner.   department is   professionalism.   department.
                                                                                                   3.9
                                                                                                             1.8
                                                                    provided.
                                                            respectful.
                                                                                      useful to our
                                                     contact.
                                                                                                             1.3
                                                                                        3.8
         Labor Relations         A     98.7%   3.9    3.8    3.9      3.8      3.9     school.     3.9     (frequency)
         Leadership Development   A    98.0%   3.9    3.9    3.9      3.8      3.9      3.9        3.9       1.5
         Professional Development   A   99.3%   3.9   3.9    3.9      3.8      3.8      3.9        3.9       1.6
         Professional Standards   A    96.0%   3.8    3.7    3.9      3.8      3.6      3.8        3.9       1.7
         Recruitment and Retention   A   99.1%   3.9   3.9   3.9      3.9      3.9      3.9        4.0       1.9
         Information Technology
         IT Enterprise Applications   A   96.7%   3.8   3.7   3.8     3.7      3.7      3.8        3.9       1.7
         IT Infrastructure & System   A   98.4%   3.8   3.8   3.9     3.8      3.8      3.9        3.9       1.7
         Support
         IT Security             A     98.5%   3.8    3.8    3.9      3.8      3.8      3.9        3.9       1.5
         IT Technical Operations   A   96.2%   3.8    3.8    3.8      3.7      3.8      3.8        3.9       1.7
         Operations
         Facilities Management &   B   88.9%   3.5    3.5    3.7      3.5      3.3      3.5        3.7       2.0
         Construction
         Planning & Intergovernmental   A   96.4%   3.8   3.8   3.9   3.8      3.8      3.8        3.9       1.2
         Relations
         School Food Services    A     96.7%   3.8    3.8    3.8      3.7      3.8      3.8        3.8       2.0
         Transportation Services   C   77.6%   3.2    3.2    3.3      3.1      3.1      3.2        3.3       2.8
         Student Health & Wellness
         Behavioral & Mental Health   A   92.8%   3.7   3.6   3.8     3.5      3.6      3.6        3.8       2.0
         Health Services         A     93.5%   3.7    3.6    3.7      3.5      3.6      3.7        3.8       1.6
         Safe Schools            A     94.6%   3.8    3.7    3.9      3.7      3.7      3.8        3.9       2.1
         Support Services        A     93.3%   3.7    3.6    3.7      3.7      3.6      3.7        3.7       1.7
         Deputy Superintendent/Chief of Schools
         Adult & Community Education   A   98.5%   3.9   3.8   3.9    3.9      3.9      3.8        3.9       1.5
         Multicultural Education   A   97.6%   3.8    3.8    3.9      3.8      3.8      3.8        3.9       1.9
         Regional Office         A     99.0%   3.9    4.0    4.0      3.9      3.9      3.9        4.0       3.1
         School Transformation   A     90.5%   3.7    3.6    3.7      3.6      3.8      3.7        3.6       1.2
        144  SUPERINTENDENT ANNUAL REPORT
   139   140   141   142   143   144   145   146   147   148   149