
Page 56 - Superintendent Annual Report 24-25
P. 56
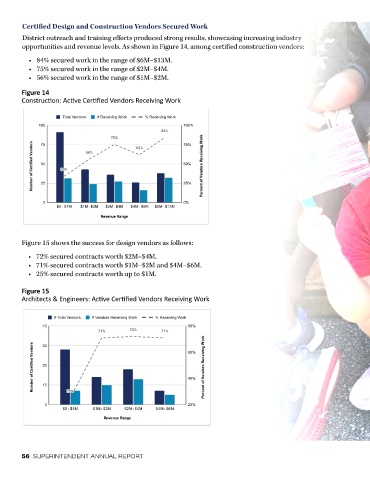
Certified Design and Construction Vendors Secured Work
        District outreach and training efforts produced strong results, showcasing increasing industry
        opportunities and revenue levels. As shown in Figure 14, among certified construction vendors:

           •  84% secured work in the range of $6M–$13M.
           •  75% secured work in the range of $2M–$4M.
           •  56% secured work in the range of $1M–$2M.

        Figure 14
 Construction - Active Certified Vendors Receiving Work as of March 13, 2025
        Construction: Active Certified Vendors Receiving Work


 Range  Total Vendors  # Receiving Work  % Receiving Work
 $0 - $1M  91  31  34%
 $1M - $2M  43  24  56%
 $2M - $4M  36  27  75%
 $4M - $6M  26  16  62%
 $6M - $13M  38  32  84%


        Figure 15 shows the success for design vendors as follows:

          •  72% secured contracts worth $2M–$4M.
          •  71% secured contracts worth $1M–$2M and $4M–$6M.
          •  25% secured contracts worth up to $1M.

        Figure 15
 Architects & Engineers - Active Certified Vendors Receiving Work as of March 13, 2025
        Architects & Engineers: Active Certified Vendors Receiving Work


 #
 Range  # Total Vendors Vendors Receiving Work Receiving Work
 %
 $0 - $1M  28  7  25%
 $1M - $2M  14  10  71%
 $2M - $4M  18  13  72%
 $4M - $6M  7  5  71%
 $6M - $13M  0  0  0%


        56  SUPERINTENDENT ANNUAL REPORT