


Page 40 - Demo
P. 40
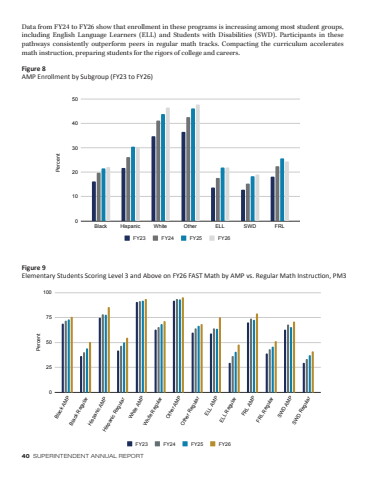
40 SUPERINTENDENT ANNUAL REPORT Percent01020304050Black Hispanic White Other ELL SWD FRLFY23 FY24 FY25 FY26Data from FY24 to FY26 show that enrollment in these programs is increasing among most student groups, including English Language Learners (ELL) and Students with Disabilities (SWD). Participants in these pathways consistently outperform peers in regular math tracks. Compacting the curriculum accelerates math instruction, preparing students for the rigors of college and careers. Figure 8AMP Enrollment by Subgroup (FY23 to FY26)Figure 9Elementary Students Scoring Level 3 and Above on FY26 FAST Math by AMP vs. Regular Math Instruction, PM3 Percent0255075100Black AMPBlack RegularHispanic AMPHispanic RegularWhite AMPWhite RegularOther AMPOther RegularELL AMPELL RegularFRL AMPFRL RegularSWD AMPSWD RegularFY23 FY24 FY25 FY26


