
Page 32 - Superintendent Report 2023-24
P. 32
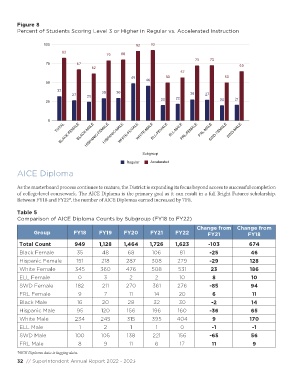
Figure 8
        Percent of Students Scoring Level 3 or Higher in Regular vs. Accelerated Instruction


                   100


                    75


                    50


                    25


                     0
                                     HISPANIC-FEMALE
                         TOTAL                                          ELL-MALE    FRL-MALE    SWD-MALE
                          BLACK-FEMALE BLACK-MALE  HISPANIC-MALE WHITE-FEMALE WHITE-MALE ELL-FEMALE  FRL-FEMALE  SWD-FEMALE


                                                             Subgroup

                                                      Regular   Accelerated
        AICE Diploma


        As the masterboard process continues to mature, the District is expanding its focus beyond access to successful completion
        of college-level coursework. The AICE Diploma is the primary goal as it can result in a full Bright Futures scholarship.
        Between FY18 and FY22*, the number of AICE Diplomas earned increased by 71%.

        Table 5
        Comparison of AICE Diploma Counts by Subgroup (FY18 to FY22)

                                                                                   Change from  Change from
               Group            FY18      FY19       FY20       FY21      FY22          FY21             FY18

         Total Count            949       1,128      1,464      1,726     1,623         -103             674
         Black Female            35         48        68         106        81           -25              46
         Hispanic Female         151       218        287       308        279           -29             128
         White Female           345        360        476       508        531           23              186

         ELL Female               0         3          2          2         10            8               10
         SWD Female              182        211       270        361       276           -85              94
         FRL Female               9         7          11        14         20            6               11
         Black Male              16         20        28         32         30           -2               14
         Hispanic Male           95        120        156        196       160           -36              65
         White Male             234        245        315       395        404            9              170
         ELL Male                 1         2          1          1         0            -1               -1

         SWD Male               100        105        138        221       156           -65              56
         FRL Male                 8         9          11         6         17           11                9
        *AICE Diploma data is lagging data.
        32  // Superintendent Annual Report 2022 - 2023